Geomagnetic Storms Explained

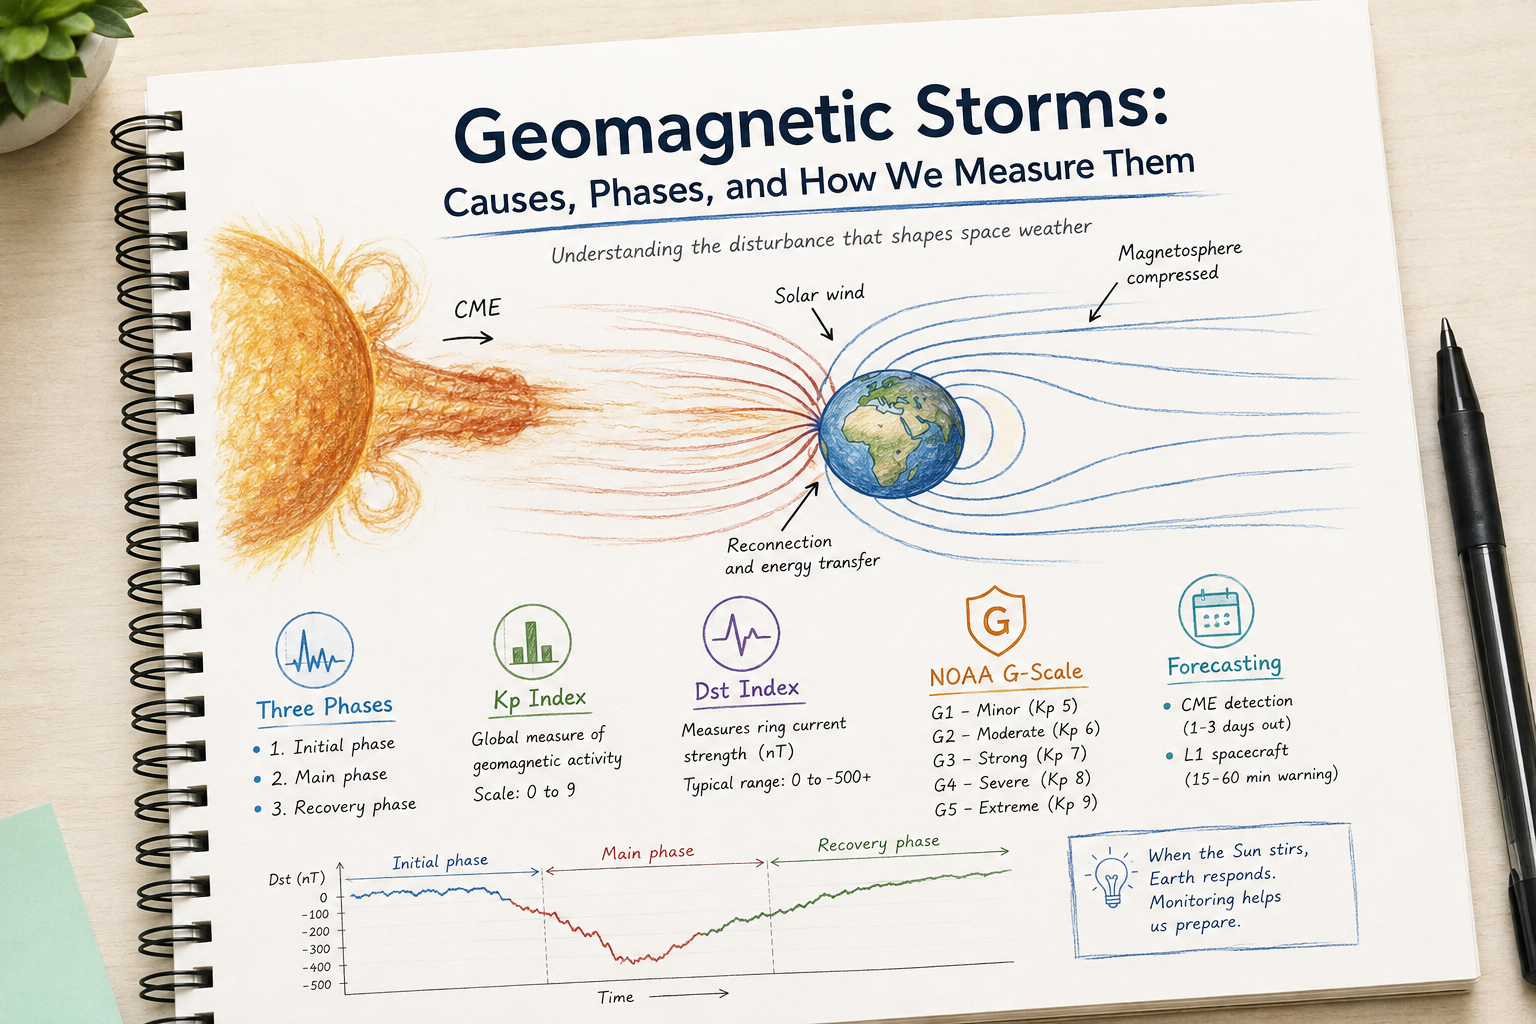
A geomagnetic storm is what happens when the Sun's activity, in the form of a coronal mass ejection (CME), finally reaches Earth and pushes back against the planet's own magnetic field. The mechanics of that arrival, how a CME's magnetic field lines up against Earth's and either connects or deflects, are covered in Coronal Mass Ejections (CMEs) Explained. This piece picks up from that point onward and focuses on the storm itself: what it is, what drives it, how it unfolds in stages, and how scientists measure its strength.
What Is a Geomagnetic Storm?
A geomagnetic storm is a temporary but significant disturbance of Earth's magnetosphere, the magnetic bubble that surrounds the planet and normally shields it from the constant dynamic pressure of the energetic, charged solar wind. During quiet conditions, this bubble holds a fairly steady shape. During storm conditions, the incoming magnetic field from a CME reconnects with Earth's own field, compressing the magnetosphere and reconfiguring its field lines. That reconfiguration releases energy directly into the magnetosphere, and this energy accelerates charged particles, pushing them to move faster and in greater numbers through the upper atmosphere and the space around Earth. Moving charged particles are themselves an electric current, so this surge of fast moving particles shows up as strong electric currents sweeping through the region. To describe the storm that follows, scientists use a set of parameters, phases, indices, and scales, each one capturing a different side of that same disturbance, discussed below.
What Causes a Geomagnetic Storm?
Coronal mass ejections are the most familiar trigger, and the strongest storms almost always trace back to one. But they are not the only cause. The Sun's corona also has gaps in it called coronal holes (CH), regions where the Sun's magnetic field opens up and lets solar wind escape faster than it does elsewhere, forming what is called a high speed stream (HSS). As the Sun rotates, this faster stream sweeps around and catches up to the slower solar wind released earlier from other parts of the Sun, piling up against it. This pileup is called a corotating interaction region (CIR), and because coronal holes can persist for months while the Sun rotates roughly every 27 days, these regions tend to sweep past Earth on a repeating rhythm, producing smaller, recurring storms rather than the one-off disturbance that a CME brings.
The underlying requirement of a CIR to start a geomagnetic storm is the same one described in the CME article: the incoming magnetic field must be oriented in the opposite direction to that of the Earth, (that is in the southward direction) so as to cause a connection before any real disturbance can begin.
The Three Phases of a Geomagnetic Storm
A storm upon its commencement moves through three distinct stages namely, initial, main and recovery phases, and its effects at any given hour depend on which stage it is in.
The initial phase begins the moment the disturbance first strikes the magnetosphere. The incoming solar wind pushes against the magnetosphere and squeezes it into a smaller space. Squeezing a magnetic field into less space packs its field lines closer together, and closer field lines mean a stronger field, so ground based magnetometers often register a sudden, sharp jump in magnetic field strength known as a sudden storm commencement. This phase can last from minutes to a few hours, and it does not always happen. Some storms skip straight to the main phase.
The main phase is where the storm does its real work. As reconnection funnels energy into the magnetosphere, charged particles get trapped and pushed into a ring shaped current circling the Earth at roughly the distance of geosynchronous orbit, called the ring current. A loop of moving current generates its own magnetic field, and this ring current's field points in the opposite direction to Earth's own field at the surface below it. So as the ring current strengthens, its field increasingly cancels out part of Earth's field, which is why magnetometers on the ground read a weaker field the stronger the storm becomes. This phase typically lasts several hours to about a day and is when the aurora, satellite drag, and GNSS disturbances described in the article: Coronal Mass Ejections (CMEs) Effects on Space Dependent Technologies are at their most severe.
The recovery phase follows as the ring current gradually loses its particles and decays, and the magnetosphere settles back toward its normal shape. This is usually the longest phase, often stretching from several hours to a few days, and how long it takes depends on how intense the main phase was.
Measuring a Storm
The Kp Index
Scientists need a way to describe how disturbed the magnetosphere is at any given instant during a geomagnetic storm. The building block for that is the K index, a number from 0 to 9 that a single magnetometer station calculates every three hours based on how far the local magnetic field has strayed from its normal quiet day pattern. But one station only tells you what the magnetosphere is doing overhead of that station, not what it is doing everywhere else. To get a true picture of the storm, scientists take K index readings from a network of ground based magnetometers spread across the globe. These individual readings from stations on different continents are then standardised and averaged into one combined value that represents the whole planet at once. This planetary version is called Kp, and it is the most widely used single number description of a storm's strength.
A Kp of 0 to 2 describes quiet conditions, 3 to 4 describes unsettled to active conditions, and anything from 5 upward marks storm level activity, with 9 representing the most extreme disturbances on record. Because it draws on stations worldwide rather than one location, Kp is less a measurement of any single physical process and more a combined snapshot of how disturbed the magnetosphere is, planet-wide, at that moment. That is exactly why it is the standard reference for space weather alerts, and the basis for the G-scale, a scale described further down that translates Kp into plain language storm ratings.
The Dst Index
Another way to measure geomagnetic storms is by tracking the ring current directly, rather than sampling the magnetic field worldwide the way Kp does. The Dst index is built to track the ring current (described in the subsection on storm phases). It is calculated from magnetometer stations positioned near the equator. Equatorial stations are the best choice because the ring current is not scattered randomly around Earth, it circles the planet in a ring roughly above the equator, out near geosynchronous orbit, the way a hula hoop might sit around Earth's waist. Any moving loop of charge generates its own magnetic field, the same way current flowing through a coil of wire in an electric motor generates one, and for a ring positioned this way, that field points in the opposite direction to Earth's own field at the ground directly beneath it. Stations sitting near the equator are positioned directly under this ring, so they feel its opposing field most strongly and most directly. Stations near the poles, by contrast, sit far from the ring current's plane and instead pick up interference from a different set of currents that flow at high latitudes, making them a noisier, less direct read on the ring current specifically. That positioning is why Dst relies on equatorial stations, and it reports the result continuously, in nanoteslas (nT), rather than in three hour steps like the K index. A quiet day sits close to zero nT. A storm's ring current cancels out part of Earth's field rather than adding to it, so the measured field drops below its normal quiet day value, and Dst records that drop as a negative number, the way a temperature drop below a baseline gets recorded as a negative change. A significant storm can push Dst to negative 100 nanoteslas or lower, and the most extreme storms on record, such as the March 1989 storm that knocked out Hydro Quebec's grid, pushed Dst below negative 500 nT. Because Dst responds directly to how strong the ring current has become, researchers often treat it as the more physically precise measure of a storm's true intensity, even though Kp remains the more commonly cited figure in public alerts.
The NOAA G-Scale
Kp and Dst are useful to scientists, but neither one tells the public or a grid operator, at a glance, how worried to be. For that, NOAA's Space Weather Prediction Center translates Kp values into the G-scale, a plain language ranking that runs from G1 to G5.
G1, described as minor, corresponds to Kp 5 and typically brings weak fluctuations to power grids and minor impact on satellite operations. G2, moderate, corresponds to Kp 6 and can put high latitude power systems under some strain, along with increased drag on low orbit satellites. G3, strong, corresponds to Kp 7 and is where GNSS and HF radio disruptions of the kind detailed in the CME effects article become noticeable at mid latitudes. G4, severe, corresponds to Kp 8. G5, extreme, corresponds to Kp 9, the level at which widespread voltage control problems, possible transformer damage, and complete HF blackouts across entire regions become likely. The May 2024 storm and the March 1989 Quebec storm both reached G5.
How Often Do Geomagnetic Storms Happen?
The Sun's activity does not stay constant. It follows a roughly regular eleven year cycle, rising and falling in an ongoing rhythm of magnetic activity. During this cycle, the number of sunspots, flares, and CMEs the Sun produces rises toward a peak called solar maximum, then falls back toward a quiet period called solar minimum, before rising again.
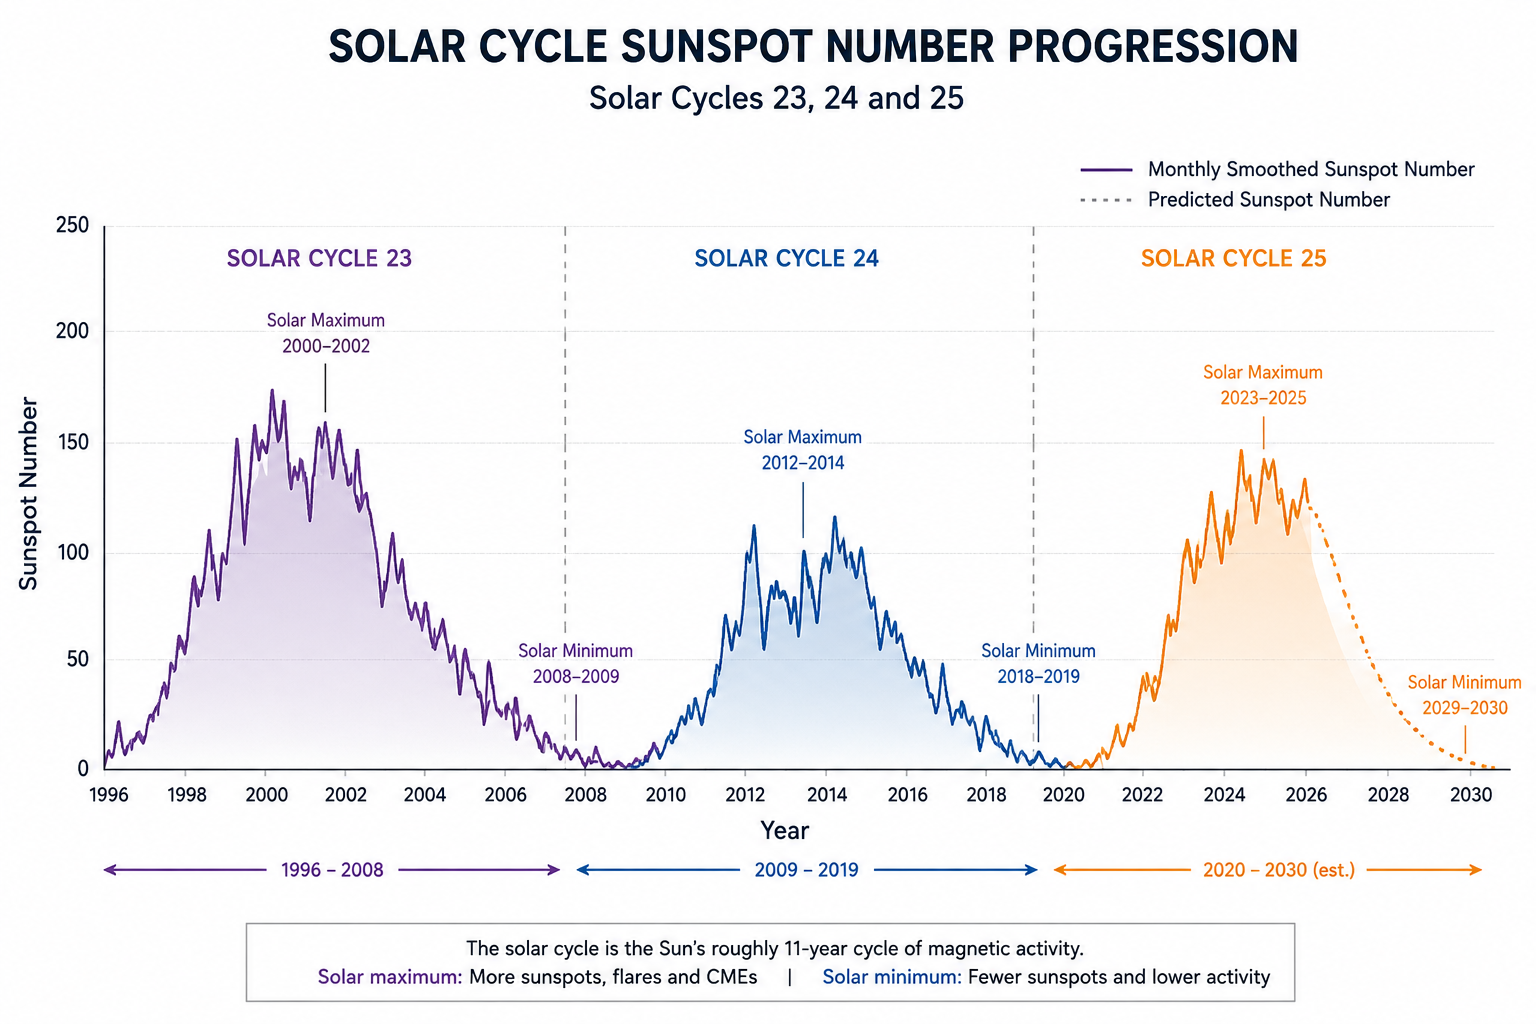
Geomagnetic storm frequency tracks closely with this same cycle. CMEs are the main driver of the strongest storms, so as CME activity rises and falls with the solar cycle, storm activity rises and falls right along with it. The years around solar maximum are when major storms become far more likely, while the years around solar minimum can pass with barely any storm activity at all. G1 level storms are common, occurring roughly two thousand times over a typical cycle, while G5 storms are rare, with only a handful expected across an entire cycle. Most of the storms that make global news occurred close to a solar maximum. The May 2024 storm struck right at the peak of Solar Cycle 25, and the October 2003 Halloween storms occurred a few years into the declining phase that followed the peak of Solar Cycle 23, still within the broader window of elevated activity that trails a maximum.
Forecasting a Geomagnetic Storm
Storm forecasting begins well before the disturbance arrives, starting with identifying that a CME has erupted and working out the direction it is facing. Coronagraphs, instruments used to spot a CME leaving the Sun by blocking out the Sun's bright disk to reveal the fainter corona around it, allow scientists to estimate the CME's speed and likely arrival time, typically one to three days out. This gives forecasters a first warning that a CME is heading toward Earth. But that early estimate carries real uncertainty, particularly around the CME's magnetic orientation, since it is that orientation, whether the CME's field points opposite to Earth's own field or the same way, that decides whether reconnection happens and a storm actually follows, as covered in Coronal Mass Ejections (CMEs) Explained. This detail cannot be measured directly from the coronagraph images alone, so for those first one to three days, forecasters know a CME is coming but cannot yet say for
The final, most reliable warning comes from a spacecraft stationed at the L1 Lagrange point, a location roughly 1.5 million kilometres from Earth toward the Sun. Normally, anything placed between the Sun and Earth would be pulled toward one or the other and would need constant fuel to stay in place. But at this particular spot, the Sun's gravity pulling one way and Earth's gravity pulling the other way even out, so a spacecraft parked there can hold a steady position without being dragged off course, making it an ideal permanent lookout post facing the Sun.
Spacecraft such as DSCOVR and ACE sit at exactly this point, directly in the path anything travelling from the Sun to Earth must cross, including both the ordinary solar wind and a CME. The solar wind is the Sun's constant background outflow of particles, present at all times, as compared to a CME which is a distinct, much denser and faster burst of solar material that gets launched on top of that background flow and pushes through it like a wave moving through water already in motion. DSCOVR and ACE sit directly in that shared path, so they are constantly monitoring the ordinary solar wind's speed, density, and magnetic field. When a CME arrives, its leading edge shows up at these spacecraft as a sudden, sharp change in those same readings. As the CME's leading edge physically sweeps past them, their onboard instruments measure its magnetic orientation and speed directly, resolving the very uncertainty that made earlier coronagraph based estimates unreliable.
L1 sits so close to Earth relative to the CME's overall multi day journey from the Sun thus, this direct measurement only arrives shortly before the CME itself does. That gives forecasters a final warning window of about fifteen to sixty minutes before impact. It is not a lot of time, but it is enough for satellite operators to adjust their satellites' orientation to reduce drag, for grid operators to prepare their equipment for the induced currents a storm can cause, and for airlines to reroute flights away from the polar paths most exposed to the disturbance.